


.jpg?1638821073)
Helping investors reduce their carbon footprint
Climate change
Climate change is one of the most concerning ESG issues facing investors today. People and companies continue to generate greenhouse gas (GHG) emissions through their daily activities. These GHG emissions are a contributing factor to the increasing of our planet’s temperature which has led to extreme weather events and rising sea levels, among other consequences. At the extreme, if global temperatures continue to increase, the consequences could be much more severe. Investors have listened. Carbon intensity has become the leading metric to help them assess the impact their investment portfolios may have on climate change.
Carbon
Carbon dioxide, often simply called carbon, is the most common GHG. There are six different types of GHGs, but carbon emissions are currently causing the most concern. Scientific evidence has concluded that if carbon emissions are reduced, climate change could be significantly slowed before it’s too late. Investors are taking an active role in looking at the GHGs emitted by the companies they own to determine the impact of these organizations on the environment. Over the past few years, many companies have started reporting their carbon footprint by disclosing the amount of carbon they produce.
Carbon Intensity
Carbon intensity is a measure of a company’s carbon emissions per million dollars of revenue. This measure helps compare companies of different sizes. Capital-intensive and resource-extraction industries typically report higher carbon intensity than companies in the service industry. Companies that generate electricity from coal have a higher carbon intensity than companies producing electricity from the sun or the wind.
Scopes 1, 2, and 3
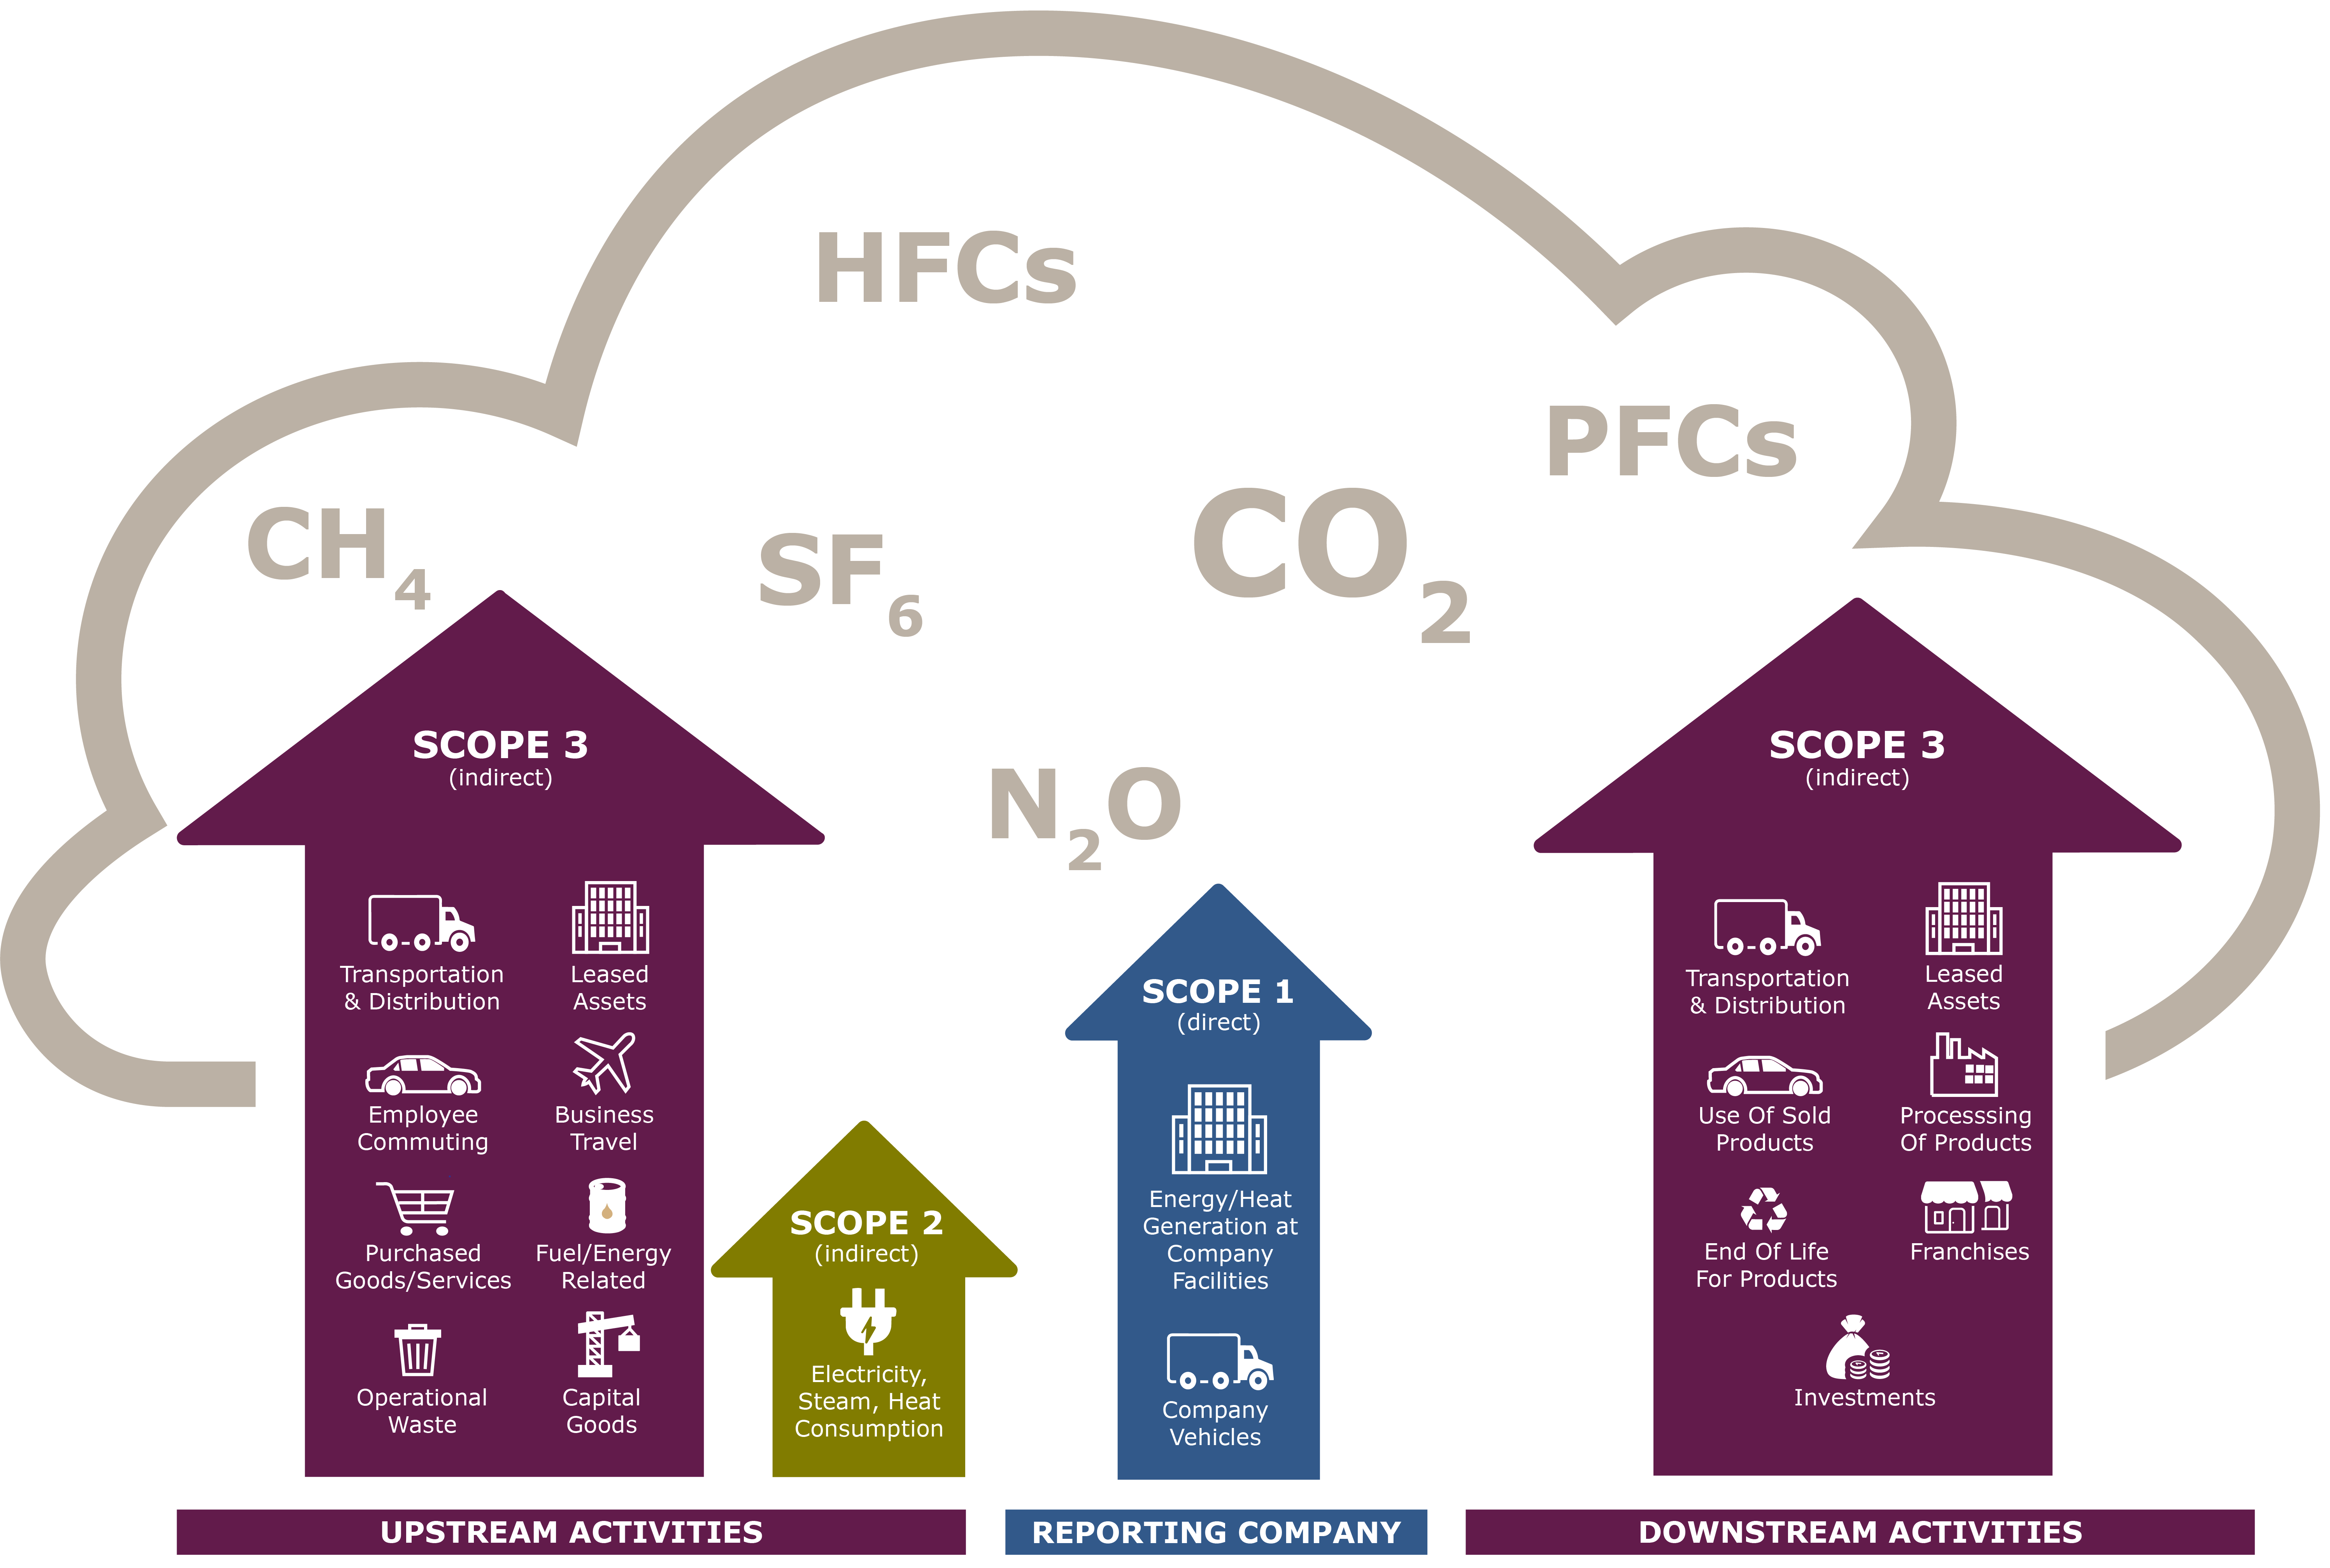
There are three types of carbon emissions: Scope 1, Scope 2, and Scope 3. Simply put, Scope 1 carbon emissions are direct emissions and are completely controllable by the company causing these emissions. Scope 2 represents indirect emissions such as electricity consumption and is more difficult to control. Scope 3 is characterized by indirect emissions that are not owned by the company, including all indirect emissions in the value chain that are linked to the company’s activity such as the emissions from consumers' product use. Most companies report Scopes 1 and 2 emissions. Very few companies report Scope 3, but more and more are doing so every year.
Weighted Average Carbon Intensity
Weighted average carbon intensity (WACI) measures the carbon intensity of an investment portfolio by weighting each company’s carbon intensity by its proportion in the portfolio. Stock market index providers such as MSCI and Standard and Poor’s provide the WACIs of their indexes so that investors can compare the WACIs of their portfolios with their benchmarks’ WACIs.
Why does WACI matter?
A portfolio’s carbon footprint, as measured by the WACI, improves investors’ understanding of the portfolio’s risks and its potential opportunities in relation to climate change. The WACI can help investment committee members answer questions from stakeholders on climate change and allows committee members to more easily act on their commitment to tackling climate change. Information is power.
FGP can help you reduce your carbon footprint
In line with many of our clients’ goals, we are pushing the companies in our portfolios to adopt net zero goals. Our engagement has been successful with several Canadian energy companies. For clients who think progress should be faster, we offer the FGP Canadian Ex-Energy Equity Fund with a WACI much lower than the overall Canadian market’s WACI. FGP calculates the WACI of its equity pooled funds and compares these figures with the WACIs of each portfolio’s benchmark. Our focus on ESG has resulted in some of our equity pooled funds having lower weighted average carbon intensities than their benchmarks, as you can see in the table below:
| Pooled Fund | Weighted average carbon intensity (WACI) compared with benchmark's WACI |
| FGP Global Equity Fund | 79% lower |
| FGP Global Smaller Companies Fund | 69% lower |
| FGP International Equity Fund | 74% lower |
| FGP Canadian Ex-Energy Equity Fund | 71% lower |
| FGP Canadian Equity Fund | 17% lower |
Note: Each Fund’s WACI is based on portfolio holdings as at June 30, 2024. We measure each holding’s carbon intensity as metric tons of CO2 (Scope 1 + Scope 2) for each USD million of revenue.
If you were to invest in a portfolio consisting of 20% in the FGP Canadian Ex-Energy Equity Fund and 40% in the FGP Global Equity Fund, with the rest in an FGP fixed income strategy, your equity portion’s WACI would be 74% lower than its blended benchmark’s WACI (as at June 30, 2024).
